POSTS
Using Fault-Tree Analysis To Reduce Failures in Software
Fault tree analysis is a top down analysis of an undesired system state to determine the best ways to reduce risk. It uses Boolean logic to combine contributing events, giving overall probabilities of failure. Fault trees are used primarily in high-risk industries such as aerospace, nuclear, and chemical. However, it can also be used in software to review and harden systems against failures.
Walking through a fault tree
Suppose we’re concerned with the uptime of our Software as a Service (SaaS). We wanted to run a formal analysis to understand why this is happening.
We’ll start from the top of the analysis with our end state: Site unavailable.
What might be contributing causes to this outage?
CDN not delivering assets
Frontend server errors (bad HTML, application crashes, etc.)
Backend server errors (database lookup failures, etc)
To keep this example simple, we’ll assume that these failures are independent. The CDN serves static content like images and javascript and not pages rendered by the frontend servers.
We can recognize that any one of these conditions can be true, which means they contribute to site availability through an OR operation. Events can be combined with standard Boolean logic: AND, OR, XOR. There are some additional combination functions you may not be familiar with such as Priority AND – an AND where failures must occur in a given order for the condition to occur.
Wikipedia has a reference with the symbols used.
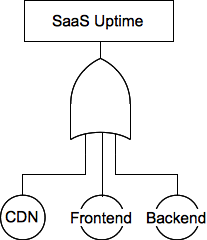
Our initial fault tree
In a formal fault tree analysis, we would assign probabilities to each event. The overall uptime of our SaaS is 2 9s (99%). This means our system is in a failure state 1% of the time.
Our CDN is “always” up according to our records, but the SLA is 4 9s (99.99%). We can treat the SLA as our probability of success. The chance of failure is then 0.01%.
We can measure the uptime and error rates of the frontend servers. Suppose that our frontend servers have 99.97% uptime. That is to say, only .03% of the time the frontend server is at fault – a code bug produces bad output, the uwsgi or nginx process dies, etc.
If we had no further data measured or known about our systems, we could determine approximately the probability of failure on the backend systems. In the case of an AND combination, we’d multiply the probabilities P(Uptime) = P(CDN) * P(Frontend) * P(Backend). However, since this is an OR combination, and because the failure rates are small (~0.01), we can approximate as the sum of individual probabilities:
P(Uptime) = P(CDN) + P(Frontend) + P(Backend)
This gives us a probability of failure of the backend of 0.96 (1 - 0.01 - 0.03), or an uptime of 99.04%. If we had measured values for the backend uptime which did not match this estimation, we should re-evaluate assumptions made (e.g. OR vs AND), verify the correctness of the failure modeling used, or consider additional causes of failure not initially identified.
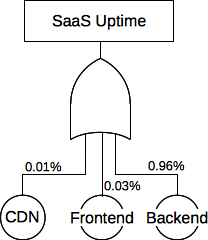
The fault tree with the failure percentages noted
Where does this backend failure rate come from? Repeat the process to identify the components of failures, extending the tree. Considering that the application backend contributes the most to the SaaS downtime, we should start tackling the problems there. We would identify several potential solutions and consider the return on investment (ROI) in how it relates to our uptime concerns.
Fault trees in practice
Recognize that fault trees are a tool from high risk industries where “catastrophic explosion” or “toxic vapor cloud” are unexaggerated outcomes to prevent besides “production halt”. They’re strict and formal so the documents can be reviewed and approved by multiple individuals.
Fault trees don’t need to trace failures for external systems. The CDN goes down? Maybe that’s due to ISP problems or a problem at the hosting provider. There is no need to trace that back further and try to break that down into component failures.
Fault trees for software may not require failure rates. Fault trees in high-risk industries are largely based in the physical realm – the parts purchased and installed have spec sheets with MTBF or MTTF values because they’ve been tested under a variety of conditions by the manufacturer in order to model failure rates. Software, however, may be under active use until the first failure occurs, so there is no model available. In this case, identifying and charting potential causes of failures is more important than determining the probability of a given failure.
Treating fault trees as an exercise to map dependencies will help identify single points of failure, common dependencies and co-dependencies not initially recognized, in part because software is so easy to change. It’s trivial to introduce additional dependencies by trying to pull more information into applications.
Further Reading
Fault Tree Handbook (NUREG-0492) from the US Nuclear Regulatory Commission.
For a bottom up analysis of common dependencies, check out event tree analysis. It was developed as an alternative to fault tree analysis since the fault trees of some systems become too large.